Actually, you can use this technique to debug any kind of console app where debugging on the command line interferes with the program’s output. It’s quick and easy, and unlike attaching to a running process in another shell, it allows you to debug as soon as the program starts, meaning you can catch even those fiddly bugs that only appear during set up.
If you’ve ever tried to debug an ncurses application, you’ll know how problematic it can be.
Using printf statements makes a mess of your visual output…
Debuggers get the keyboard input all mixed up in the shell…
Eugh. HEADACHE!
There is a way to seamlessly debug your ncurses application and it is probably easier than you realised.
Enter gdbserver.
That’s for embedded stuff though, right?
It is!
In fact, that’s what I spent most of my time using when I was a humble employee.
But my application runs on my desktop.
That’s ok – did you know that you can ‘remote’ debug a desktop application with gdbserver?
Huh?
What I mean is, you don’t need to have a host-target setup. You can use gdbserver locally to debug pesky applications where you need the console for both debugging and for interacting with your program.
Let me show you what I mean.
First of all you need to make sure gdbserver is available:
sudo yum install gdb-gdbserver
Then, open up a terminal, cd to the directory of your executable and type:
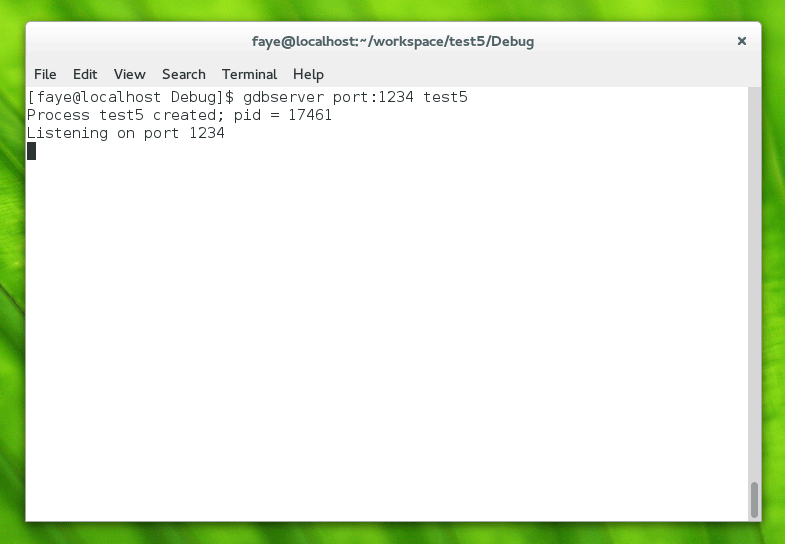
gdbserver port:1234 <filename>
You should see gdbserver tell you it’s creating a process and that it is listening on port 1234. You don’t have to use port 1234 – any old number (that isn’t in use!) will do.

Now open up another terminal window, cd to the directory of your executable and type:
gdb <filename>
Then:
target remote localhost:1234
This connects gdb to the gdbserver running in your other terminal (exciting!). You can confirm this because the other window will update to display Remote debugging from host 127.0.0.1.
Next, add a breakpoint:
b main
should do it.
And then press ‘c’ to continue (you are already ‘running’ so remote debugging is started with the continue command).
The debugger will execute to main and at that point you should be able to see output confirming the file name and line number where the debugger has halted.
Now you’re free to debug as usual:

If you’re repeating this sequence a lot, it can be really helpful to pop the commands in a .gdbinit file.
Hold on, I can’t shut gdbserver down!
Ah yes, it can be a little tricky regaining access to your terminal once gdbserver has gotten hold of it 🙂
If CTRL-C is being ignored, switch to another terminal and type:
ps -A
Locate the gdbserver process id and type:
kill -9 <pid>
This will bring your window back.
Now my terminal is all messed up!
If your terminal isn’t displaying correctly, with everything appearing on the same line/across the screen (which often happens when you quit or segfault out of an ncurses app, because you haven’t done the requisite cleaning up), you can reset your terminal with:
stty sane
Happy debugging 🙂
